Going full circle completing the square

I usually use the last six week of the school year in geometry to teach circles: Arc lengths, chords, secants, tangents, etc. Which I have outlined in the Geometry Planning Guide

The following school year students begin Algebra 2 and promptly forget these properties of circles. They also start the new school year frustrated and overwhelmed because they forgot all about the quadratics they learned in Algebra 1 during their year in geometry.

This school year I decided to make some changes to the last unit in order to set students up to be more successful in the transition from Geometry to Algebra 2:

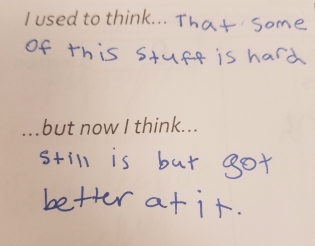
1)   I began with a modified version of Fawn’s task: When I got them to beg

I distributed an index card to each student and gave them students 5 minutes to make a beautiful work of art on the card. When time was up, students turned in their art, I shuffled the cards and redistributed them to the class.

I cut orange paper to the same size as 3×5 inch index cards, and told the students it was “Real Gold” it was very expensive and we could not waste any of it (they referred to orange paper as “Gold” for the rest of the school year). They had to try to make a frame for the art and tape it down to the assignment sheet that I distributed to them with an explanation of their thinking and strategy.


It worked. They begged me to help them find a better way to complete this task.

2)  Complete the Square with algebra tiles.

I used this activity from Salt Lake City Schools to guide student thinking. Students worked in small groups to create squares using algebra tiles and relating the squared and factored forms of perfect square quadratic equations. We referred back to this task often throughout the unit.

3) Solving equations by Completing the square notes and practice

I used Sarah Hagan’s foldable for completing the square. The following day I planned a basic practice sheet for students to just build fluency with solving equations by completing the square, but it was so nice out, we decided to do this on the sidewalk instead. (Note: Always keep sidewalk chalk in your classroom for beautiful day emergencies)

4) Applications of completing the square

I returned students framed art task from day 1 above, and they wrote and equation and  found the appropriate frame size using completing the square, then measured their estimated solution and reflected on their work.

Next we completed the Shell center task: Cutting Corners

5) Connecting Quadratic equations to Parabolas

I printed and laminated sets of the domino cards from the Shell Center task: Representing Quadratic Functions Graphically and students completed the loop and filled in the blanks. They then were able to summarize the relationship between standard, vertex and factored form of a quadratic equation and understand what each of the forms of the equation illustrated about it’s graph.

The next day, students worked on the Desmos Activity: Match My Parabola. I was able to pause and pace this activity as needed and monitor students understanding in order to support students understanding of the various forms of a quadratic equation.

6) Converting a quadratic equation between vertex, standard and factored forms

Now that students understood the usefulness of the various forms of quadratic equations, they wanted to be able to convert a quadratic equation between the various forms:

This slideshow requires JavaScript.

6) Develop the equation of a circle

I started with this question:

Capture

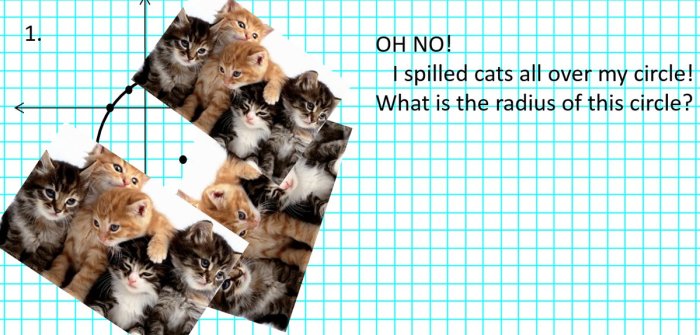
There were a few students who shouted out “Pythagorean Theorem!” and students realized they could construct a right triangle and find the length of the hypotenuse/radius.

Next, I gave students individual whiteboards and asked them to draw a circle centered at (0,0) with a radius of 5. Then I asked them to name coordinates of points that they know for sure were on the circle and I would have them explain how they knew. Eventually we identified 12 points on the circle.

After this, I asked students what the relationship was between the x and y coordinates on the circle. Most groups were able to explain that they were all related by the Pythagorean theorem because x² + y² = 5².

At this point, I had students complete the first side of the “Going Round in Circles” sheet from this Shell Center lesson in order to see how well students understood the discussion and to see how they could apply their learning.

The next class period began by asking students to find the radius of a circle given the coordinates of the center and a point:

2017-05-09 10.18.00
The vertical height of the right triangle should be 12, not 13! This was corrected during the class discussion.

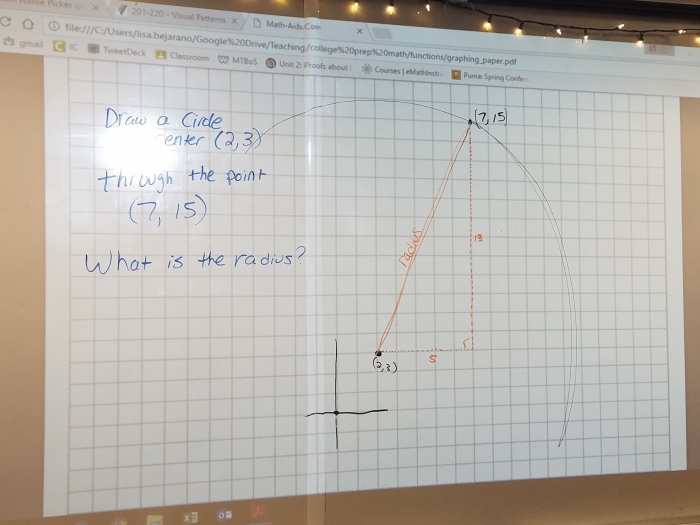
We used this to determine the radius of this circle as (7 – 2)² + (15 – 3)² = 13²

After further discussion, students were able to generalize the equation of a circle centered at (h, k) to be:  (x – h)² + (y – k)² = r²

Then students worked in small groups on the vertical white boards to complete the task included in the Shell center lesson: Sorting Equations of Circles 1

I printed and laminated the cards to make them easier to use on vertical dry erase boards and for facilitate discussion.

Finally, students completed the “Going Round in Circles, Revisited” sheet included in the lesson linked above.

7) Find the center and radius of a circle by completing the square

I created a foldable for students to summarize the equation of a circle that included examples of using completing the square to put an equation of a circle into a standard form. We followed this with additional practice.

<foldable below should be printed on legal sized paper> 

Every time we referred back to completing the square I made visual diagrams connecting it back to their initial development of their understanding of how to complete a square. I never stated any shortcut like, “just divide by 2 and square it.”2017-05-26 10.46.00-2  
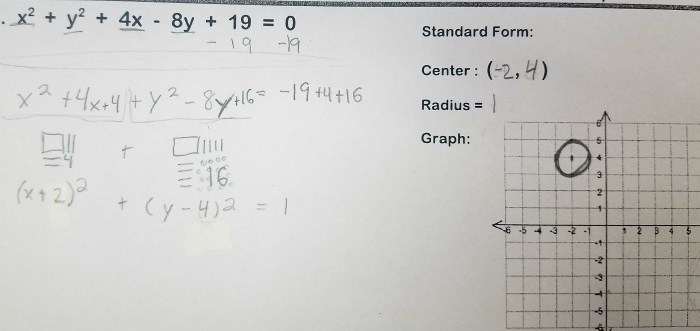
Students developed a genuine understanding of the process, which will hopefully lead them to increased success as they begin algebra 2 next school year.

2017-05-02 08.31.39
Woot!!

Surface Area Interactive Notes

I gave this sheet to students and had them cut out the nets and use a ruler to measure and calculate the area of each face.

Then we folded on the dashed lines and taped only 1 face into our Interactive notes, adding any additional information next to the net.

This is one of my favorite notebook pages because students refer back to it often to help them visualize all of the faces of 3-d solids in later practice.

2015-03-18 16.11.54 2015-03-18 16.12.10 2015-03-18 16.12.16 2015-03-18 16.12.42 2015-03-18 16.12.55 2015-03-18 16.13.01  2015-03-18 16.13.44

Starting Geometry with Definitions

Every year, geometry starts with students defining many key terms so that we can use this vocabulary as we work through the content. For some reason, this school year, I couldn’t remember what I’d done in the past and I took this to mean that it wasn’t as awesome as it could be. As I planned the first few days I had these ideas in mind:

  • I wanted students to know 16 key geometry terms.
  • I wanted to use the frayer models that fit in students interactive notes as Sarah Hagan describes here.
  • I wanted students to develop their own definitions and not simple copy from a book so that they owned the vocabulary and processed each term.
  • I wanted to create and foster a culture of collaboration in my class as the school year began.
  • I wanted students to depend on their peers and teacher provided resources for support of content and not rely on the teacher as the purveyor of information.
  • I wanted to be able to easily verify student’s definitions for accuracy outside of class time.
  • I wanted to pre-assess students ability to write effective definitions and writing in general.

I love the Kagan Geometry book  (but really wish it was available in a digital format) I don’t always follow the prescribed structures, but the resources can be very useful. There are pages in this book for developing definitions that contain only images of examples and non examples – which fit well with the frayer model that I planned to use. In searching the MTBoS for ideas, I found this post by Pam Wilson.

This what I ended up doing. I am satisfied with the way this went and will do it again next year:

The setup:

I copied the terms, blown up large onto different colored card stock  &  laminated them. Each color represented a group, so I make 5 colors with 3 words per color & I kept one to use as an example with the whole class. I also made a ton of copies of Sarah’s Frayer model for students to use.

2014-08-25 08.53.25

The implementation:

1. I used the widget example from Discovering Geometry (chapter 1). It shows strange blobs and says “these are widgets”, then there is another group of strange blobs and it says “these are not widgets”. I have students define widgets in their groups. Then they read their definition and we try to draw a counterexample. Then we discussed what makes a good definition and we were ready to go!

2 I projected the “perpendicular lines” examples and non examples. We completed a frayer model for the term.

2014-08-25 13.28.14

3. Students worked in small groups with their 3 terms copying the examples & non-examples, then writing good definitions for each term. I set a timer for 10 minutes.

4. Groups rotate to another station. repeat. 10 minute timer.

5. This continued until the end of class. Students turned in their completed Frayer model sheets.

<At this point each student had about half of the 16 words defined.>

6. That evening I read their definitions (every single one!) and wrote feedback in the margins. No grade.

7. The next class period, I gave all of the students back their definitions with my feedback and gave them time to correct or improve their work.

8. Give one, get one – Speed dating style! Students each got a blank Frayer definition sheet and sat across from a student who was not in their original group. The would talk, find a term that they needed and share. Each students would give one definition to their partner and get one from their partner. Then a timer would go off and they would rotate & repeat.

9. While the students speed dated, I listened and taped pickers to the back of their interactive notebooks.

10. As a quick check for understanding, the students used their plickers and answered multiple choice questions on the terms for the last 10 minutes of class.

11. Homework was to cut them out and put them on specified pages of their interactive notes.

12. I made a Word Wall by simply taping the laminated cards to the wall after the lesson. Easy Pezy!

2014-08-25 13.24.22 2014-08-25 13.24.54

Basic Geometry Constructions 4-tab Foldable

[update: 10/05/15: I no longer use this in my classes because I developed a better sequence of lessons for teaching geometry where students deduce each construction using reasoning instead of copying steps from a website or myself.]

Following an activity developing definitions in geometry, the first major unit of geometry will be constructions.

I plan to take 2 class periods to complete this foldable for their interactive note books with time for practice.  Each tab has space for both the steps and an example for segments and angles, except of course the last tab which contains constructing a line parallel to another line through a point and constructing a perpendicular line.

Instead of just talking at my students, I’m considering having students complete these notes in pairs using this website for directions: http://www.mathopenref.com/tocs/constructionstoc.html

Then I can circulate and provide support as needed. I’ll update this post after using this with students reflecting on its usefulness.

2014-08-11 08.06.54

Day 113: Mean, Median Mode & How to think about data

This went really well! I gave the students a sheet that listed everyone in the class and they had to fill out eye color, shoe size & average number of texts they send per day. I did this because students sometimes need to be forced to interact with each other and I have a few new students that I wanted everyone to interact with. I also hate it when students don’t know all of their peers names, so I try to encourage this when I can.

Then, it got interesting. I asked the class to find the mean eye color. They started to work, a few asked how to find the mean and I explained that they should add them all up and divide by the number of numbers. They grabbed calculators & looked back at their data, confused. I shut up and listened to them….”that doesn’t make sense” “How do I add colors?”, etc…

…enter discussion on qualitative vs quantitative data, considering the information when trying to describe the data, discussions on how to summarize qualitative data. Awesomeness.

Next we looked at shoe size: students immediately complained that men & women have different shoe sizing systems. We considered converting them all to men’s sizes, then we talked about how useful this information would be….other students suggested separating them into separate averages for men & women. The class agreed that this would provide more useful information.

For texts we discussed outliers and how they impact the mean. We related it to grades. The class decided that the median would be best to describe this data set.

We also made a fun foldable. It was a worthwhile day considering the purpose in interpreting data as well as reviewing basics.

2014-03-05 13.24.20 2014-03-05 13.52.46